By Kerem Atam, HelioCampus
At HelioCampus we build and maintain Typfolio, an open-source library that turns Typst templates and data into PDFs in the browser. Accessibility has been part of it from the start: every PDF is tagged by default, PDF/UA is a compile option, and the dev tools warn about tables without headers.
Our latest release goes a step further, into the part most generators get wrong: telling a screen reader which row and column each cell belongs to. This post is the reasoning behind that work, written so you can use it with any tool. The second half shows it in Typfolio.
Part one · any tool
A PDF has two layers, and you only see one
The layer you see is ink on a page: glyphs at coordinates, lines, coloured boxes. Nothing in it says “this is a heading” or “these cells are a table”. A screen reader given only that layer reads text in the order it was drawn and guesses the rest.
The second layer is the tag tree: an outline that says what each piece of content is. Heading, paragraph, list, table, row, header cell, figure. Assistive technology reads this layer. If you generate PDFs, producing it well is part of the job, in the same way semantic HTML is part of building a web page.
What to deliver
This is the short list we hold any generated PDF to, ours included.
| Deliver | Because |
|---|---|
| A tagged PDF | Without tags there are no headings, tables or figures to navigate, only a stream of text |
| A document title and a language | The title is the first thing announced; the language decides how every word is pronounced |
| Real headings, in order | Headings are how a listener skims. Big bold text is not a heading, and a jump from level 1 to level 3 breaks the outline |
| Tables with header cells | A cell’s value is announced with the headers that label it. No header cells, no context |
| Row headers, not only column headers | “Autumn, 9” is half the answer. “Autumn, Ada, 9” is the whole one |
| Alt text on every figure that says what it means | A figure is read as its alt text and nothing else, including the labels drawn inside a chart |
| Decoration marked as decoration | Page numbers, running headers and rules should be skipped, not read out on every page |
| A reading order that matches the meaning | Columns, sidebars and footnotes are read in tag order, which is not always the order they sit on the page |
Tables are where it goes wrong
Tables are the hard part. A sighted reader finds a value by running an eye along a row and up a column. A listener cannot. When they land on a cell, the screen reader has to tell them where they are, and it can only do that from what the PDF says.
Three things in the tags make that work:
- Header cells are marked as headers. A header cell is tagged TH and a data cell TD. A row that only looks like a header, because it is bold, is data.
- Each header says what it labels. A header carries a scope: its column, its row, or both. Without it, a header in the first column could be read as labelling everything below it.
- Each cell lists its headers. For tables with more than one level of header, every cell names the headers that apply to it, so nothing has to be inferred from position.
The test is one question per data cell: which headers does the PDF say apply to it? For a score in a grades table, the answer should be the term and the student. If it is only the term, the table cannot be followed by ear.
Charts are figures, and figures are their alt text
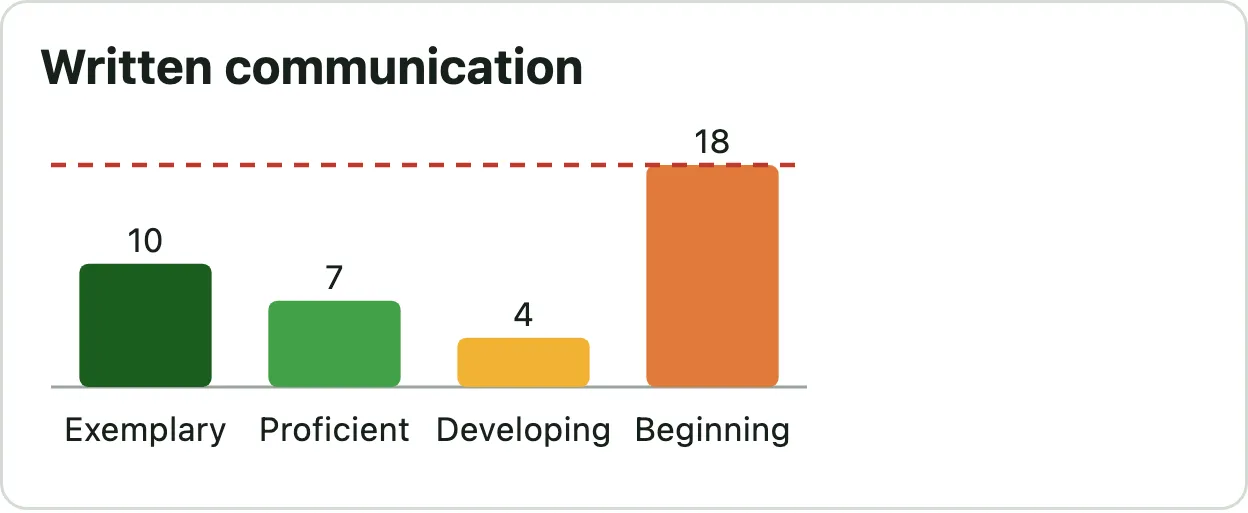
A chart drawn into a PDF may contain real text: axis labels, values above bars. It is still one figure, and a screen reader reads the figure’s alt text in place of all of it. So the alt text has to do the chart’s job in words: what kind of chart, what stands out, how the result compares with any target.
Before
Alt text
Students per level for Written communication: Exemplary 10, Proficient 7, Developing 4, Beginning 18.
After
Alt text
Bar chart of students per level for Written communication. The largest group is Beginning (18). 17 reached Proficient or above, 1 short of the goal of 18. The full numbers are in the table “Students per level”.
- Describe what the chart means, not how it looks. “The bar touches the dashed line” tells a listener nothing; “one short of the goal” does.
- Put the full numbers in a real table next to the chart and point to it from the alt text. The table is the accessible version of the chart.
Check it like you would check a web page
You cannot review tags by looking at the PDF. Use three checks, in this order of cost:
- Look at the tag tree while you build the template. Most mistakes are obvious the moment you can see them.
- Run a validator, such as veraPDF against PDF/UA, in your tests. It confirms the tags are well formed. It does not judge whether they are true.
- Listen to it with a real screen reader before you ship. Only a person can say whether the reading order and the wording make sense.
A PDF that declares PDF/UA and passes a validator can still be hard to use. Conformance is a floor.
Part two · how we do it in Typfolio
What changed in Typfolio
Typfolio compiles Typst templates to PDF with WebAssembly, in the browser or in Node. It already tagged every PDF and marked the cells inside table.header(...) as column headers. The latest release adds two things.
- Row headers and nested headers
@typfolio/core0.5.0 turns on Typst’s in-developmenta11y-extrasfeature by default. It addspdf.header-cell,pdf.data-cellandpdf.table-summary. - A way to see the tags
@typfolio/dev-tools0.6.0 has a panel that shows the tag tree beside your page, marks the selected tag on the PDF, and lists the headers of any cell.
npm install @typfolio/core@0.5.0 @typfolio/wasm@0.3.0
npm install --save-dev @typfolio/dev-tools@0.6.0
In each example below, the template is on top and what the PDF says is underneath. Changed lines are tinted. The trees come from real compiles, read back from the PDF.
The table fixes, in a template
The most common one
Name each row
Wrap the first cell of each row in pdf.header-cell(scope: "row"). And keep the header row in table.header: a bold first row looks the same and is tagged as data.
Before
Template
#table(columns: 3,
  table.header[Student][Autumn][Spring],
  [Ada], [9], [8],
)
What the PDF says
Table
  TR
    TH  scope=Column  "Student"
    TH  scope=Column  "Autumn"
    TH  scope=Column  "Spring"
  TR
    TD  headers=[Student]  "Ada"
    TD  headers=[Autumn]  "9"
    TD  headers=[Spring]  "8"
After
Template
#table(columns: 3,
  table.header[Student][Autumn][Spring],
  pdf.header-cell(scope: "row")[Ada], [9], [8],
)
What the PDF says
Table
  TR
    TH  scope=Column  "Student"
    TH  scope=Column  "Autumn"
    TH  scope=Column  "Spring"
  TR
    TH  scope=Row  headers=[Student]  "Ada"
    TD  headers=[Autumn, Ada]  "9"
    TD  headers=[Spring, Ada]  "8"
What the reader hears: before, “Autumn, 9”. After, “Autumn, Ada, 9”.
To line the two sides up, the “before” tree leaves out the THead and TBody groups Typst writes around the rows. A table that uses pdf.header-cell or pdf.data-cell is written without them.
For grouped columns
Say which header sits under which
When one header spans several columns, mark the headers below it with pdf.header-cell(level: 2).
Before
Template
#table(columns: 3,
  table.header(
    table.cell(rowspan: 2)[Student],
    table.cell(colspan: 2)[Score],
    [Autumn], [Spring],
  ),
  [Ada], [9], [8],
)
What the PDF says
Table
  TR
    TH  scope=Column  "Student"
    TH  scope=Column  "Score"
  TR
    TH  scope=Column  "Autumn"
    TH  scope=Column  "Spring"
  TR
    TD  headers=[Student]  "Ada"
    TD  headers=[Score, Autumn]  "9"
    TD  headers=[Score, Spring]  "8"
After
Template
#table(columns: 3,
  table.header(
    table.cell(rowspan: 2)[Student],
    table.cell(colspan: 2)[Score],
    pdf.header-cell(level: 2)[Autumn],
    pdf.header-cell(level: 2)[Spring],
  ),
  [Ada], [9], [8],
)
What the PDF says
Table
  TR
    TH  scope=Column  "Student"
    TH  scope=Column  "Score"
  TR
    TH  scope=Column  headers=[Score]  "Autumn"
    TH  scope=Column  headers=[Score]  "Spring"
  TR
    TD  headers=[Student]  "Ada"
    TD  headers=[Autumn]  "9"
    TD  headers=[Spring]  "8"
What the reader gets: a chain. “9” belongs to “Autumn”, and “Autumn” belongs to “Score”.
If the sub-headers fill a whole row, Typst does this without the new feature: add a second table.header(level: 2, ...). Use pdf.header-cell when a cell such as “Student” spans both rows and must stay at the top level.
For the empty corner
Take a non-header out of the header
The corner cell of a table with both kinds of header labels nothing, but inside table.header it is still tagged as one. pdf.data-cell turns it back into an ordinary cell.
Before
Template
#table(columns: 3,
  table.header([], [Autumn], [Spring]),
  pdf.header-cell(scope: "row")[Ada], [9], [8],
)
What the PDF says
Table
  TR
    TH  scope=Column
    TH  scope=Column  "Autumn"
    TH  scope=Column  "Spring"
  TR
    TH  scope=Row  headers=[(empty)]  "Ada"
    TD  headers=[Autumn, Ada]  "9"
    TD  headers=[Spring, Ada]  "8"
After
Template
#table(columns: 3,
  table.header(pdf.data-cell[], [Autumn], [Spring]),
  pdf.header-cell(scope: "row")[Ada], [9], [8],
)
What the PDF says
Table
  TR
    TD
    TH  scope=Column  "Autumn"
    TH  scope=Column  "Spring"
  TR
    TH  scope=Row  "Ada"
    TD  headers=[Autumn, Ada]  "9"
    TD  headers=[Spring, Ada]  "8"
What the reader gets: no blank header announced, and “Ada” no longer points at one.
Be careful with it. If the cell you turn into data was the only header of its column, every cell below it is left with no header at all.
Only when needed
Explain a complicated layout
pdf.table-summary attaches one sentence to the table, read before its cells. Nothing is drawn on the page.
Before
Template
#table(columns: 3,
  table.header[Student][Autumn][Spring],
  [Ada], [9], [8],
)
What the PDF says
Table
  THead ...
  TBody ...
After
Template
#pdf.table-summary(
  summary: "One row per student; the two score columns are terms.",
  table(columns: 3,
    table.header[Student][Autumn][Spring],
    [Ada], [9], [8],
  ),
)
What the PDF says
Table  summary="One row per student; the two score columns are terms."
  THead ...
  TBody ...
What the reader gets: a sentence of orientation before the first cell.
Typst’s documentation is clear that a summary explains layout, not content. For a simple table, leave it out.
Seeing the tags while you work
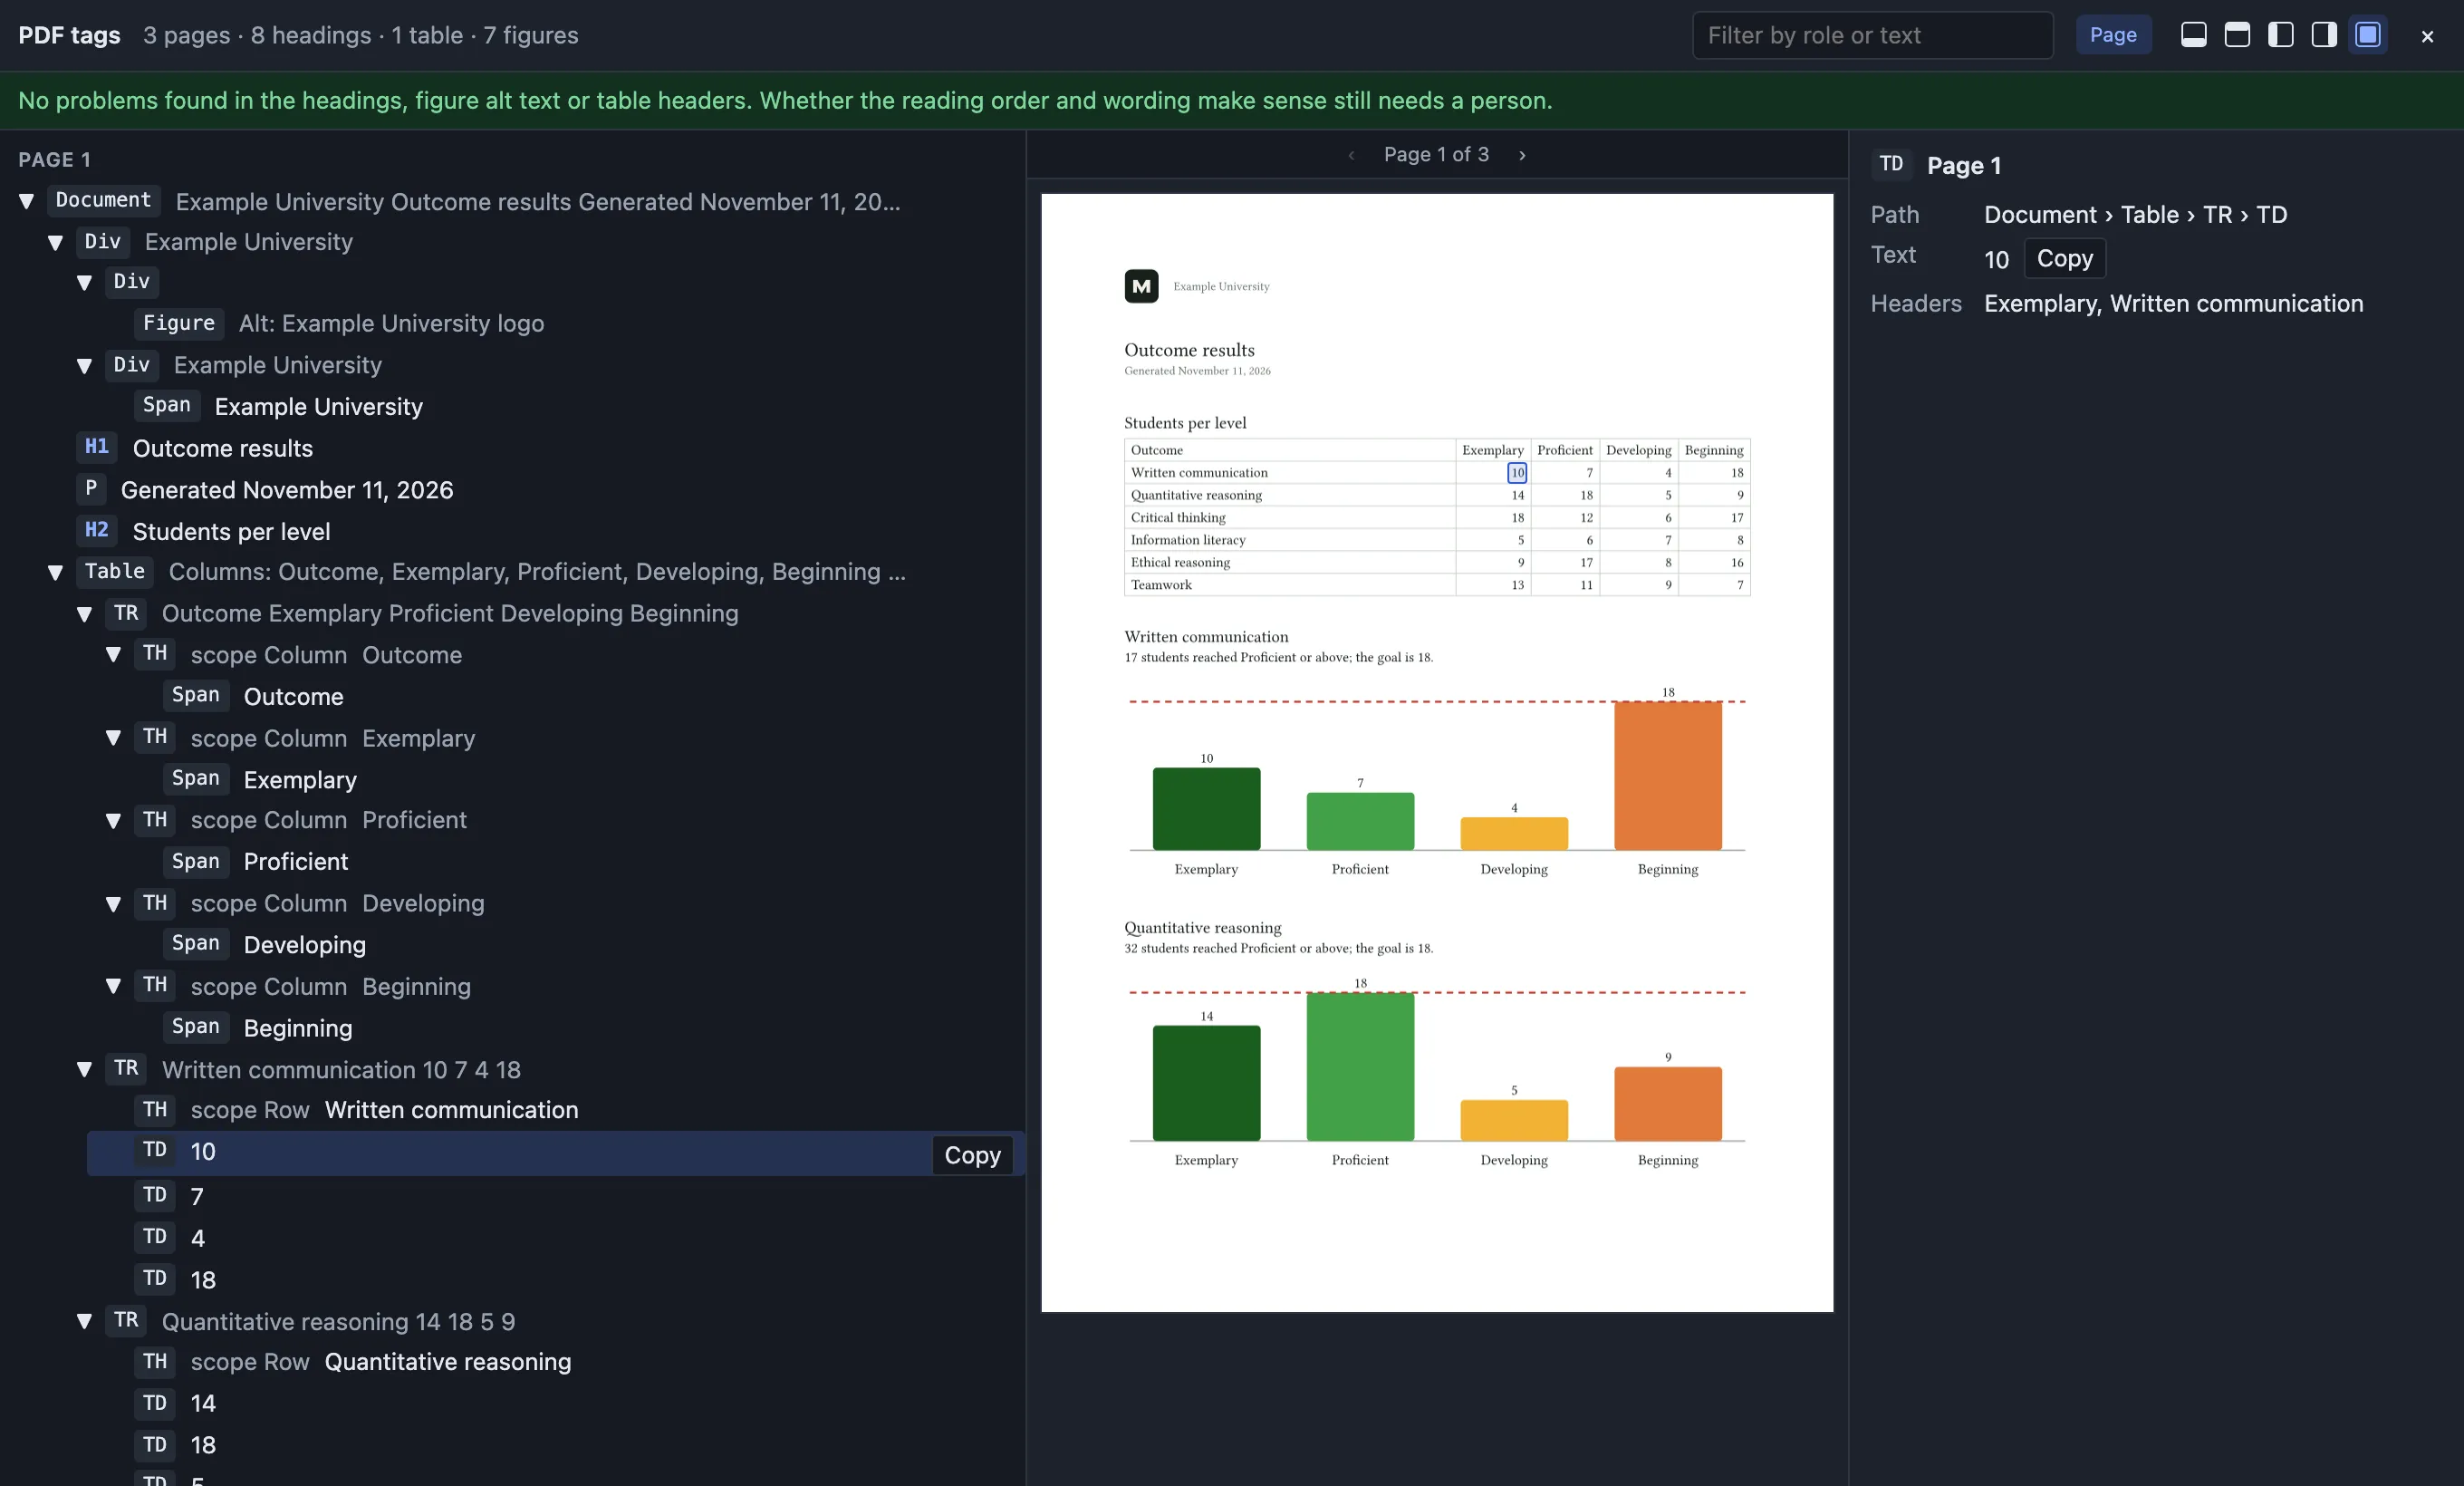
This is the first of the three checks from part one. Mount the panel once in development and hand it each PDF you compile.
import * as pdfjs from 'pdfjs-dist';
import workerSrc from 'pdfjs-dist/build/pdf.worker.min.mjs?url';
import { mountStructureDevtools } from '@typfolio/dev-tools/panel';

pdfjs.GlobalWorkerOptions.workerSrc = workerSrc;
const panel = mountStructureDevtools({ pdfjs });

// After each compile:
panel.update({ bytes: result.bytes });- Select a data cell
The “Headers” line is the answer to the one question from part one. If the row’s name is missing there, the row header is not marked. - Scan the header cells
Each TH line shows its scope. Row names should say “scope Row”. - Click on the page
Clicking a cell or a chart selects its tag, so you can check a specific spot without hunting through the tree. - Read the banner
It lists what a listener would trip over: a table with no header cells, a figure with no alt text, headings that skip a level.
Putting it in your tests
Compile as PDF/UA-1 and Typst itself refuses an image without alt text or a heading that skips a level. Then ask dev-tools for the problems neither Typst nor a validator reports, such as a table with no header cells.
import { checkStructure } from '@typfolio/dev-tools/pdf';

const { bytes } = await compiler.compile(report(sampleData), {
  pdf: { standards: ['ua-1'] },
});
assert.deepEqual((await checkStructure(bytes)).map(warning => warning.message), []);
Comments
Comments are kept in GitHub Discussions. You need a GitHub account to write one.